Smart Energy Control
Multi Commodity Matcher
In the E-Hub project, a smart energy control system has been developed to match supply and demand of electricity and heat simultaneously at the district level. This energy management system shifts the timing of demand of heating installations, refrigerators and washing machines.
Several technologies are available for matching the supply and demand of energy. The E-Hub project uses agent based technology like Powermatcher ® or IntelliGator ® software and smart grid technology. These incorporate bi-directional information and energy grids: an Intranet of Energy.
The Multi Commodity Matcher developed in this project is an extension of the Powermatcher concept (which is for electrical power only) to electricity and heat, inheriting the Powermatcher's advantages of scalability and user autonomy.
First we need to adapt the multiple (heat and electricity) bid functions for multi commodity devices. The electric and thermal power bids of these devices depend on both the electricity market price pE and the heat market price pH. Therefore, instead of a one-dimensional bid function we define two 2-dimensional bid surfaces, one for electricity and one for heat. For each multi-commodity agent, the bid surfaces represent the willingness to consume or produce electricity and heat at a range of electricity and heat prices. As an illustration, the figures below show the bid surfaces of a heat pump.
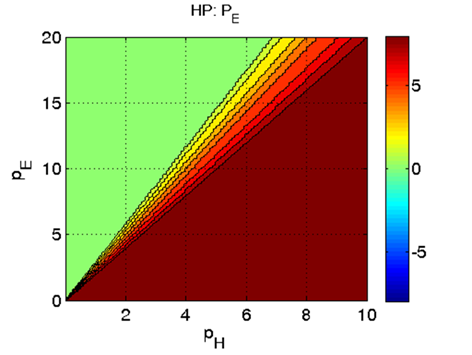
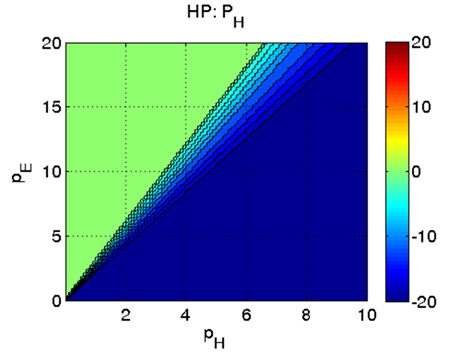
Electrical power bid surface (left) and thermal power bid surface (right) of a heat pump. The x-axis shows the heat price pH , the y-axis the electricity price pE. The colours represent the amount of power the heat pump is willing to produce as a function of the prices of heat and electricity. As an example, at an electricity price of 5 €ct/kWh and a heat price of 6 €ct/kWh the heat pump will be fully on, consuming 6.7 kWh of electricity and producing 20 kWh of heat.
The bid surfaces for each commodity can be aggregated over all devices in the market cluster. The result is shown in the graphs below.
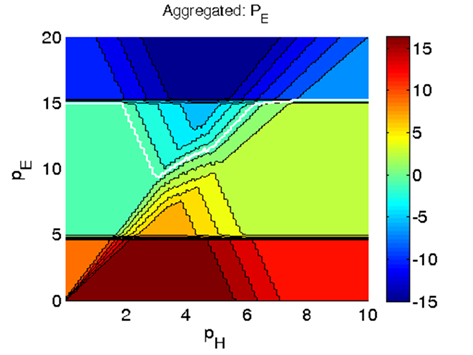
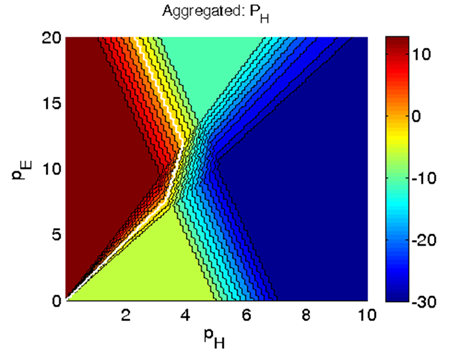
Aggregated bid surfaces for electricity (left) and heat (right). Equilibrium lines are shown in white.
In each figure two equilibrium lines stand out in white where production and consumption are balanced. The equilibrium point, at which both electrical power and thermal power supply and demand are in balance, is found at the intersection of both 'white' lines. Note that an equilibrium point can always be found if the bid surfaces are continuous and strictly descending or ascending.