Simulation Platform
Matching supply and demand
A simulation platform has been produced using the programming language Matlab. The main objective is to test the 'Multi Commodity Matcher' in the case studies of districts in Amsterdam, Leuven, Freiburg, Bergamo and Dalian (China).
In addition, we have developed a user friendly version of the simulation platform that can be used as a consultancy tool. The tool should allow municipalities, DSOs (Distribution System Operators) and other parties to assess the possibilities (and limits) of a smart energy system in achieving energy efficient or energy neutral districts. The main elements of the simulation platform are shown in the figure below.
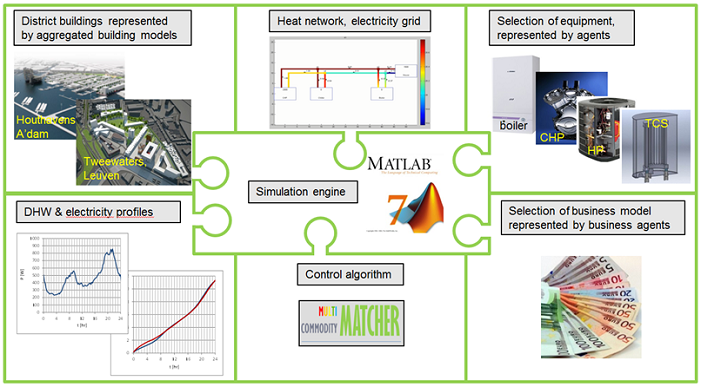
Main elements in the simulation platform used to assess new types of district energy systems
The main elements in the simulation platform are:
- Simplified dynamic models characterizing the buildings in a district (dwellings, offices etc.), being the main consumers of heat for space heating
- Characteristics of different equipment for generating and storing heat, cold and electricity.
- A heating network and electricity grid connecting consumers and producers of energy.
- Business models intended to maximise the interests of a particular stakeholder. This may be the end user interested in a low energy bill, a DSO (Distribution System Operator) interested in peak shaving or in reducing imbalance in the grid or society as a whole interested in CO2 mitigation.
- Smart energy control of heat, cold and electricity by the Multi Commodity Matcher
District Energy Management System
The simulation platform is demonstrated below with a simple configuration consisting of a house with a smart whitegood appliance, but with an otherwise 'uncontrollable' energy demand for space heating, electricity and domestic hot water. The house has a solar thermal collector on its roof and it is connected to the electricity grid, which is fed by an 'uncontrollable' producer of renewable energy (wind farm). The configuration and the results of the simulation are shown in the pictures below.
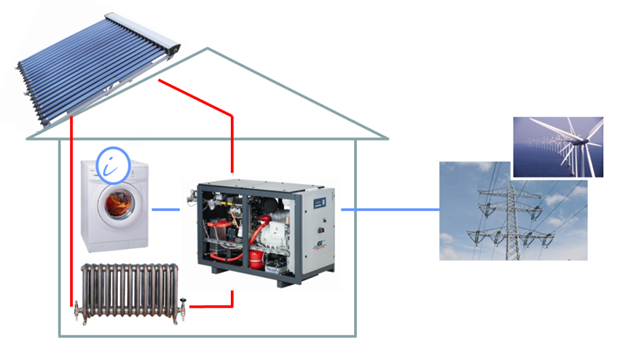
Simple configuration consisting of a house connected to the grid.
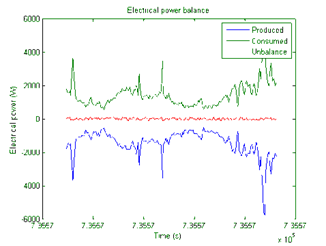
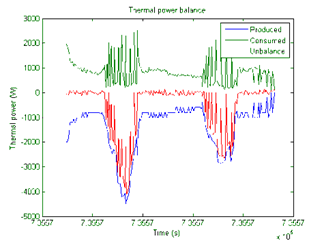
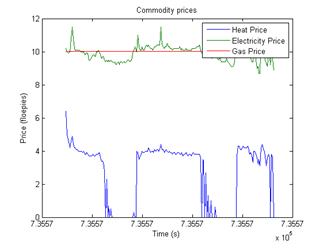
Electricity balance (left), thermal balance (middle), prices (right) over two days.
The left figure shows how supply and demand of electricity are very nearly balanced (the red line slightly varies around zero). The middle figure shows that a thermal balance cannot be reached during the day because the heat supplied by the solar collector is too large to be consumed by the house, even when the MCM tries to increase consumption by lowering the price of heat (right figure) to practically zero. A thermal storage unit (not implemented in this example) could have stored the excess heat for use later that day.