Assessing Alzano Lombardo District, Bergamo
using the Matlab simulation platform
The Matlab simulation platform has been used to assess the energy use of Alzano Lombardo, a town close to Bergamo, Italy. The smart control algorithm was able to simulate the yearly use profile of the existing district in a range +/- 15%. This yearly profile consists of the energy consumption for heating, i.e. requests for domestic hot water and energy needed to heat buildings in winter and reach the desired internal temperature set-points, as well as the electricity request profile.
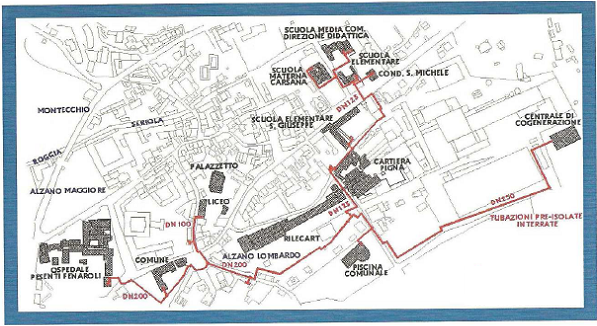
Alzano Lombardo District.
The red lines show the district heating network.
The original configuration consisted of central gas boilers for heating with no local electricity production. A second scenario has been simulated, including environmental improvements on the energy generation side: the installation of photo-voltaic panels and a bio-mass boiler. The simulation tool was used to assess the environmental impact and running cost reductions due to the introduction of renewable energy sources.
Original situation:
- 3 natural gas boilers (overall capacity 9 MWth)
- 4 km of piping network
- 13 buildings
Improved scenario:
- 2 natural gas boilers
- 1 biomass boiler
- 1 set of PV panels
- 4 km of piping network
- 13 buildings
Smart scenario:
In this case, electrical load flexibility has been simulated, acting not only at a generation level, as it was for the second scenario, but also at a demand level. The flexible electrical loads comes from the private dwellings. The third scenario has been used to test the flexibility of the electric demand in the district, since the Multi Commodity Matcher, developed in the E-Hub Project, can manage both thermal energy and electric energy requests.
The results obtained are in line with the expectations. The gradual implementation of ecological and efficient solutions in the scenarios helped to prove the benefit of such installations in terms of energy provided by traditional sources (natural gas and national electrical grid) and in terms of electrical load profile. The comparison of gas consumption and the electricity bought from the national grid between the original scenario and the last two allowed the savings to be evaluated.
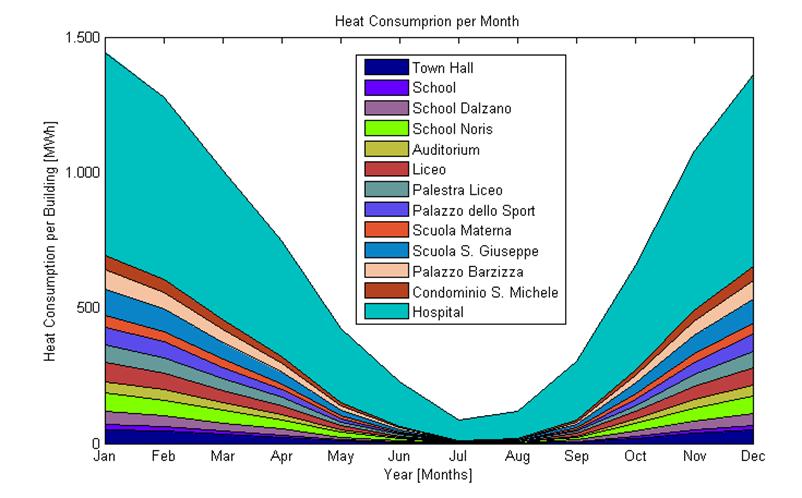
Cumulative heating energy demand by month.
The profile suggests suitable patterns from the simulation tool, since heat demand is sharply reduced during summer months, except for the hospital which demands considerable heating all year round. The profile has been compared with others and confirms the accuracy of the simulation tool and the district model.